
Are you interested in trading Bitcoin and other cryptocurrencies? If so, understanding how to read charts is a critical skill you’ll need to master.
Charts provide a visual representation of the price movement of an asset, and by using technical analysis, you can gain valuable insights into future price movements.
In this blog post, we’ll introduce you to the basics of How to read bitcoin chart and how to use it for technical analysis and price prediction.
We’ll cover key concepts like chart patterns and indicators that can help you make informed trading decisions in the crypto market.
Tools required to Read the Bitcoin chart:
- Trading View (free)
- Blockchain.com (Free)
- GlassNode (Freemium)
1. Trading View: Live Bitcoin Price chart
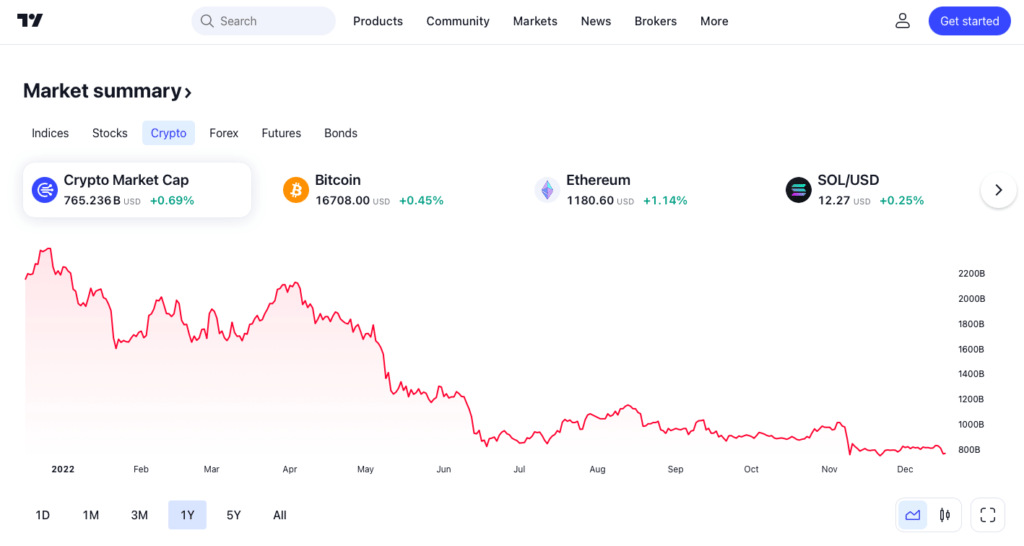
TradingView is a financial visualization platform that allows users to chart, analyze, and share financial market data. It is primarily used by traders, investors, and analysts to chart and analyze market trends, track portfolio performance, and communicate with other traders.
TradingView offers a wide range of charting tools and features, including:
- A variety of chart types (e.g. candlestick, bar, line) and time frames (e.g. 1-minute, daily, monthly)
- Technical analysis indicators (e.g. moving averages, Bollinger Bands, RSI)
- Drawing tools (e.g. trend lines, Fibonacci retracements)
- Customized alerts and notifications
- Real-time data from exchanges around the world
- The ability to share charts and analysis with other users
TradingView also offers a social aspect, allowing users to follow and interact with other traders and investors, as well as share and discuss ideas and analyses.
2. Blockchain.com: Live Bitcoin transactions
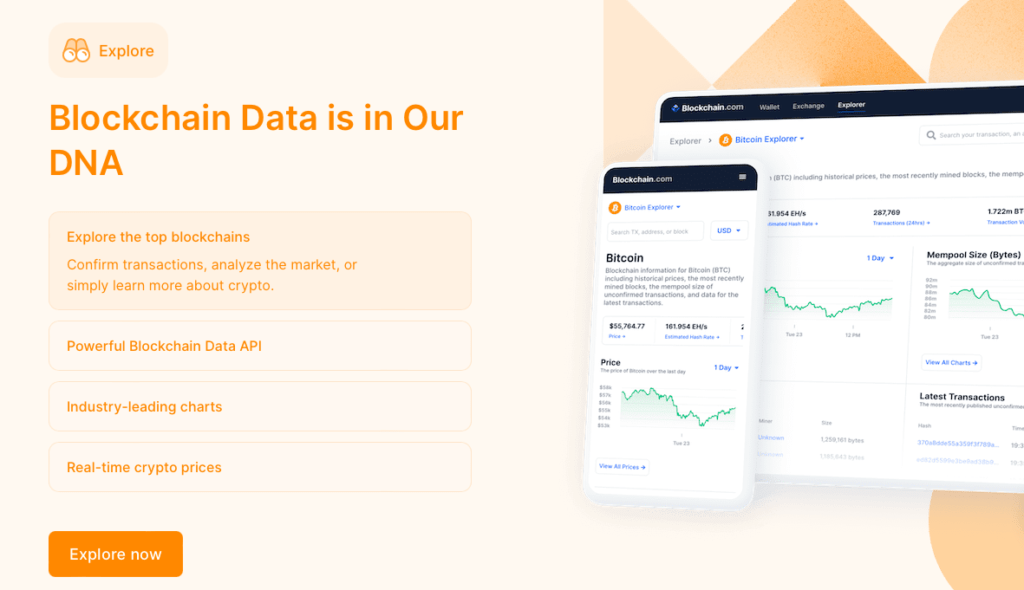
Blockchain.com is a popular online platform that allows users to explore various transactions and data on the blockchain network. It is commonly referred to as a “blockchain explorer” because it allows users to see the full history of a particular cryptocurrency’s blockchain and track the movement of coins and transactions.
Some of the key features of the Blockchain.com crypto blockchain explorer include:
- Real-time tx tracking: View the latest & historical transactions
- Address search: View balance, tx history, & relevant info
- Block details: View block height, transactions, & miner reward
- Hash search: View tx details, input/output addresses, & transferred crypto amount
3. GlassNode: Advanced On chain Data Analysis
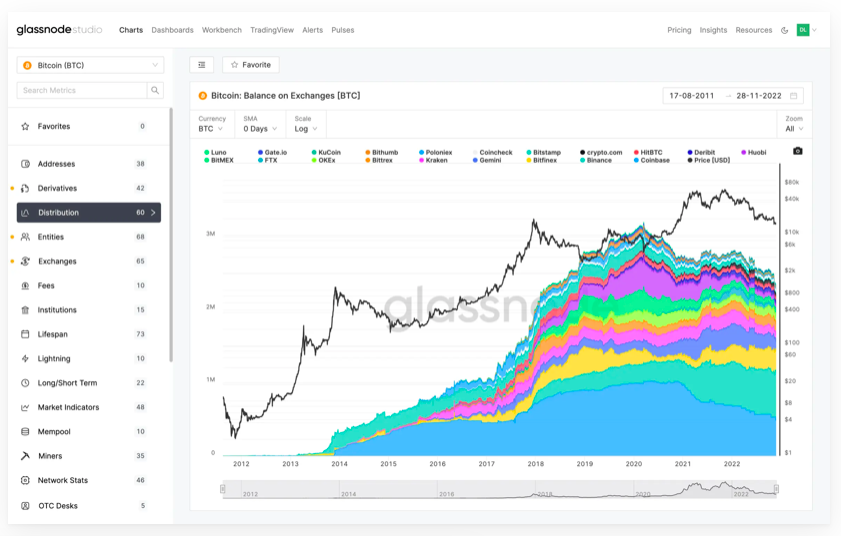
Glassnode is a suite of tools and services that enable users to explore and analyze various aspects of the cryptocurrency market and blockchain networks. Some of the key features of Glassnode include:
- Blockchain Explorer – Browse and explore blockchain transactions, blocks, and addresses.
- On-Chain Metrics – Wide range of metrics to understand cryptocurrency network health and activity.
- Market Analysis – Track cryptocurrency prices and market movements with real-time charts and data.
- Alerts and Notifications – Set up alerts for specific events or conditions on the market.
- Custom Reports – Create reports based on specific criteria for informed investment decisions.
What is Bitcoin Technical analysis?
Technical analysis is a way to evaluate securities by analyzing market activity data. It involves using charts, statistics and other tools to identify patterns and trends that can suggest buying or selling opportunities.
In the case of Bitcoin, technical analysis can help study price movements and patterns to make predictions about future prices. Analysts may employ different techniques, such as chart patterns, moving averages, and oscillators, to find trends and make trading decisions.
It’s important to keep in mind that technical analysis should not be used as the sole method of analysis. It’s best to combine it with other forms of analysis, such as fundamental analysis, which examines the underlying factors that impact asset prices.
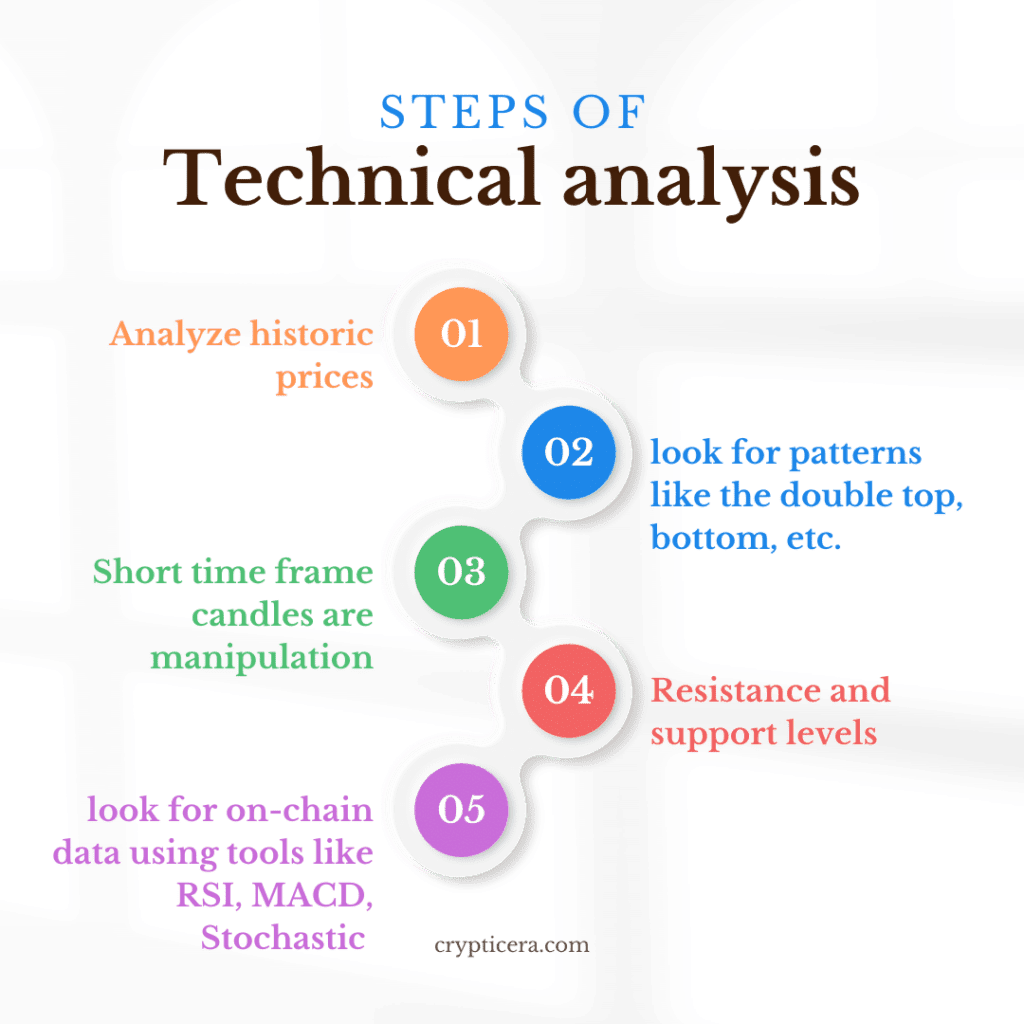
How to Read Bitcoin chart (Step-by-Step Guide)
Step 1: Support and Resistance level
Support and resistance levels are important concepts in technical analysis, which is a method of evaluating securities by analyzing statistics generated by market activity, such as past prices and volume.
In the context of Bitcoin and other cryptocurrencies, support and resistance levels can be used to identify potential entry and exit points for trades.
To read a Bitcoin chart for support and resistance levels, you will need to look for patterns in the price action. Here are some steps you can follow:
- Look for horizontal lines on the chart that represent levels where the price has consistently found support or resistance. These lines can indicate potential areas where the price may bounce or stall.
- Look for trendlines that connect a series of highs or lows on the chart. These trendlines can also indicate potential areas of support or resistance.
- Pay attention to historical price levels. If the price has previously encountered resistance at a certain level, it may do so again in the future. Similarly, if the price has previously found support at a certain level, it may do so again in the future.
- Consider the overall market trend. If the market is in an uptrend, the price may have a tendency to bounce off of support levels and encounter resistance at higher levels. Conversely, if the market is in a downtrend, the price may have a tendency to encounter resistance at lower levels and bounce off of support levels.
Step 2: Reading Bitcoin price chart patterns
There are several chart patterns that can be identified during a technical analysis of bitcoin or any other cryptocurrency.
These patterns can provide clues about the direction and strength of a particular trend and can be used to make informed trading decisions.
Some common chart patterns that may be identified in the bitcoin market include:
- Head and Shoulders: Bearish reversal, peak-dip-peak formation
- Double Top: Bearish reversal, two peaks at the same level, and a dip in between
- Double Bottom: Bullish reversal, two troughs at the same level and peak in between
- Triangle: Can be bullish/bearish, depending on the breakout direction
- Flag: Continuation pattern, a sharp move followed by consolidation
- Cup and Handle: Bullish reversal, rounded bottom, small consolidation, and dip
- Rising Wedge: Bearish reversal, series of higher lows/highs forming a wedge
- Falling Wedge: Bullish reversal, series of lower lows/highs forming a wedge
- Pennant: Continuation pattern, symmetrical triangular shape
- Reverse Head and Shoulders: Bullish reversal, trough-peak-trough formation.
Step 3: Technical Indicators for understanding Market volume, strength, and Price movements
Technical indicators are statistical tools that are used to analyze and predict the behavior of financial markets. In the context of cryptocurrency, technical indicators can be used to analyze the price movements and trends of bitcoin and other cryptocurrencies.
Here are ten popular technical indicators that are commonly used to read bitcoin chart movements and trends:
- Moving Average (MA): A moving average is a trend-following indicator that smooths out price data by calculating the average price over a certain time period.
- Bollinger Bands: Bollinger Bands are a type of price channel that is plotted two standard deviations above and below a moving average. They are used to measure volatility and identify potential trend reversals.
- Relative Strength Index (RSI): The RSI is a momentum indicator that compares the magnitude of recent gains to recent losses in order to determine whether a security is overbought or oversold.
- Stochastic Oscillator: The Stochastic Oscillator is a momentum indicator that compares the closing price of a security to its price range over a given time period. It is used to identify potential trend reversals.
- Moving Average Convergence Divergence (MACD): The MACD is a trend-following indicator that uses the difference between two moving averages to identify the direction and strength of a trend.
- Fibonacci Retracements: Fibonacci retracements are horizontal lines that are plotted on a chart at key Fibonacci levels, based on the high and low prices of an asset. They are used to identify potential levels of support and resistance.
- Ichimoku Cloud: The Ichimoku Cloud, also known as the Ichimoku Kinko Hyo, is a technical indicator that uses multiple moving averages to identify trends and identify potential areas of support and resistance.
- On-Balance Volume (OBV): The OBV is a momentum indicator that uses volume data to identify the strength of a trend. It is based on the idea that the more volume that is associated with a price move, the more significant the move.
- Head and Shoulders: The head and shoulders pattern is a chart pattern that is used to identify potential trend reversals. It consists of three peaks, with the middle peak (the head) being the highest and the two outside peaks (the shoulders) being lower.
- Trendlines: Trendlines are straight lines that are drawn on a chart to connect price highs or lows in order to identify the direction and strength of a trend.
Must Read: Top Powerful Technical Indicators for Crypto Trading
Step 4: Read Bitcoin on-chain data
- On-chain analysis (also known as blockchain analysis) is a new field that looks into the fundamentals of cryptocurrencies to help investors and traders make better decisions.
- Instead of relying on hype, sentiment, or technical analysis, on-chain analysis is based on fundamentals. This form of study can be used to compare multiple crypto-assets to uncover undervalued/overvalued coins, or it can be used to focus solely on one crypto-asset by looking at historical trends.
The main advantage of on-chain measurements is that they provide real-time insight into investor behaviors. The number of active addresses and the number of transactions are two essential on-chain indicators to keep an eye on.
If one wallet address is holding the majority of tokens, there is the chance of dumping, if he/she sells their coins.
An increase in the number of active addresses and transactions indicates a price rise.

Advantages of Reading On-chain Matrices
- Understanding market trends: By analyzing on-chain data, you can gain insight into the overall health and activity of the Bitcoin network. This can help you understand market trends and make more informed investment decisions.
- Identifying fraudulent activity: On-chain data can help you identify patterns of fraudulent activity, such as double spending or fake transactions, which can help you protect your investments and avoid scams.
- Improving security: By analyzing on-chain data, you can identify potential vulnerabilities in the network and take steps to improve security.
- Improving scalability: On-chain data can help you understand the current limitations of the network and identify potential solutions for improving scalability.
- Enhancing privacy: On-chain data can help you understand how privacy is being used in the Bitcoin network, and identify ways to enhance privacy for users.
- Improving transparency: By analyzing on-chain data, you can gain a greater understanding of the inner workings of the Bitcoin network, which can help improve transparency and trust in the system.
Bitcoin on Chain Data: The Quick Understanding
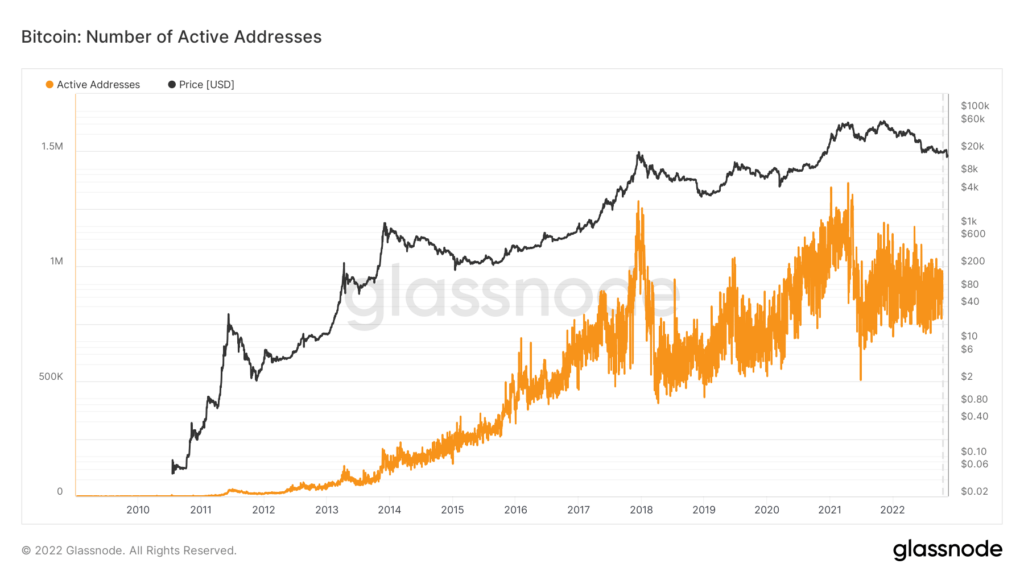
1. Bitcoin Active addresses-
This data shows how many peoples are holding bitcoin in their decentralized wallets. The number of unique addresses that were active in the network either as a sender or receiver. Only addresses that were active in successful transactions are counted.
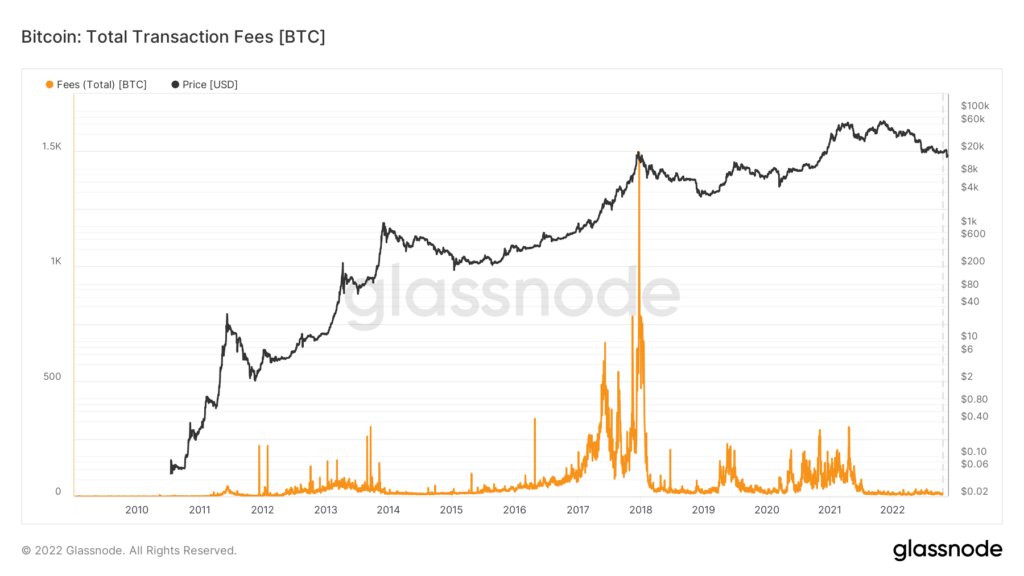
2. Bitcoin Transaction Fees
This data shows how bitcoin transaction fees change with changes in bitcoin mining difficulty and price. It also depends on the volatility of the market. The total amount of fees paid to miners. Issued (minted) coins are not included. This On-chain data is helpful in understanding how people are sending and receiving bitcoin, and if the demand for assets increases or decreases.
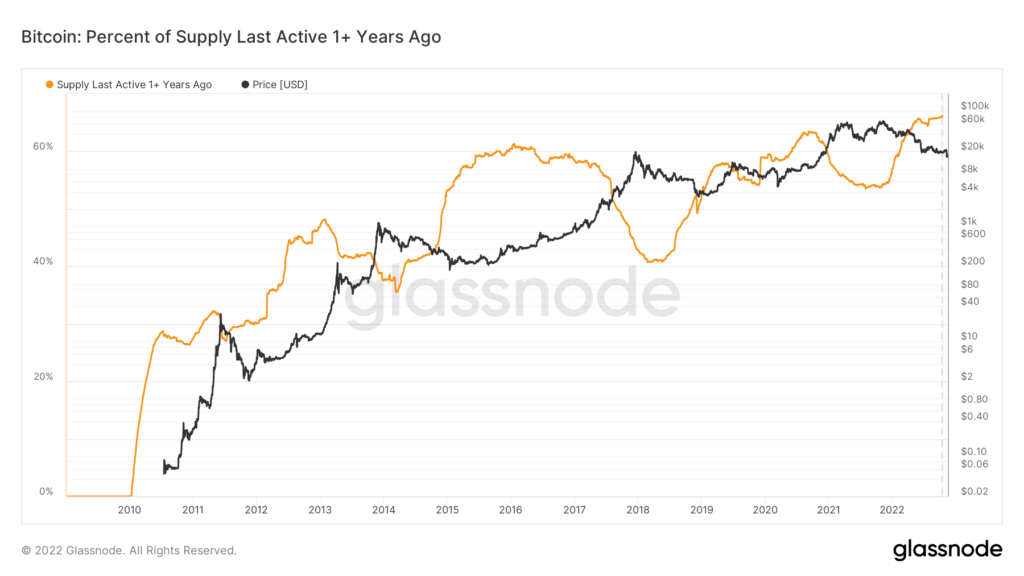
3. Fixed Circulating supply
The percent of circulating supply that has not moved in at least 1 year. This is helpful in understanding the future price movement of Bitcoin.
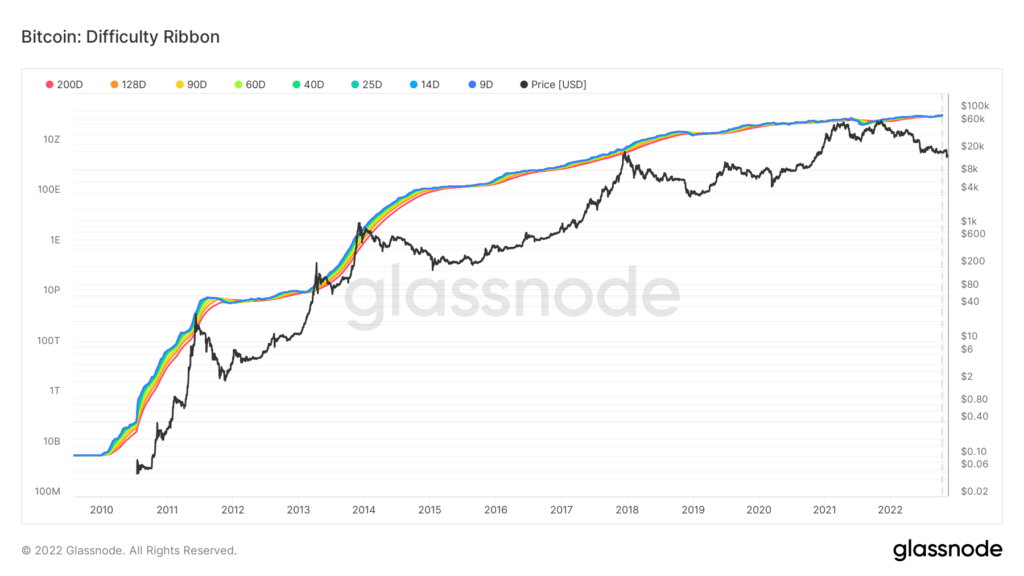
4. Bitcoin Difficulty Ribbon
The Difficulty Ribbon is an indicator that builds the ribbon using simple moving averages of the Bitcoin mining difficulty (200d, 128d, 90d, 60d, 40d, 25d, and 14d). When the ribbon compresses, historically, such times have been ideal times to buy. Willy Woo was the one who invented the Difficulty Ribbon.
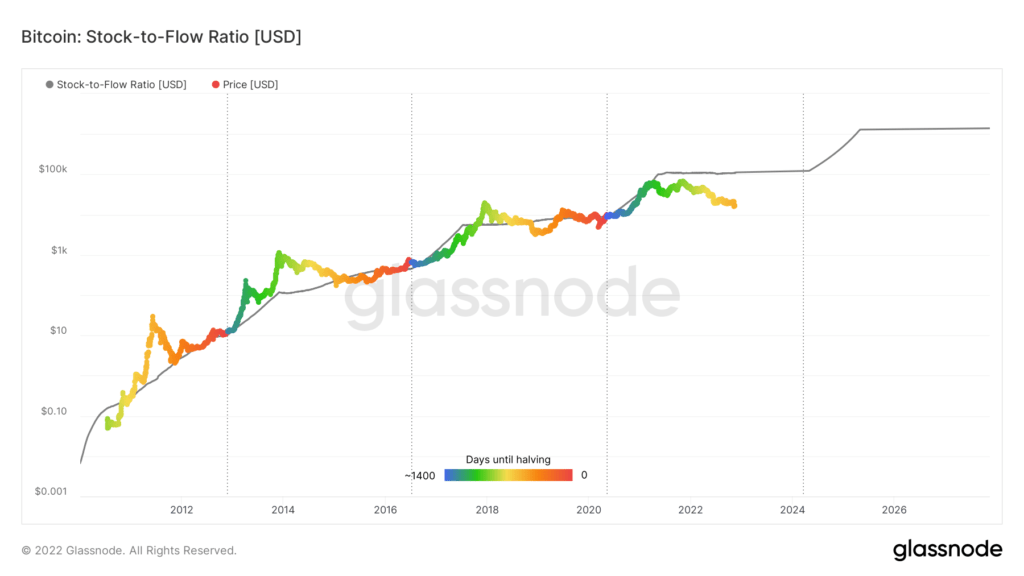
5. Bitcoin Stock-to-Flow Ratio
The Stock to Flow (S/F) Ratio is a popular model that assumes that scarcity drives value. Stock to Flow is defined as the ratio of the current stock of a commodity (i.e. circulating Bitcoin supply) and the flow of new production (i.e. newly mined bitcoins). Bitcoin’s price has historically followed the S/F Ratio and therefore it is a model that can be used to predict future Bitcoin valuations.
Bitcoin Fear and Greed Index
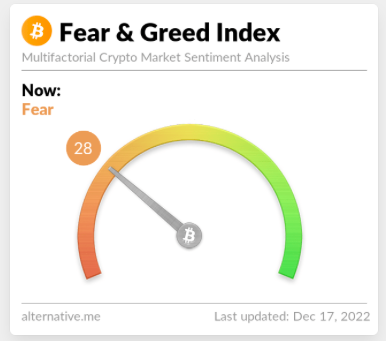
The Bitcoin Fear and Greed Index is a measure of market sentiment that aims to provide a snapshot of how investors are feeling about the market at any given time. It is based on a variety of factors, including market volume, volatility, social media activity, and the overall state of the market.
To use the index to understand price movement and market sentiment, you can consider the following:
- A high index score (above 70) indicates that investors are feeling very greedy and optimistic about the market, which may be a sign of an impending price rally.
- A low index score (below 30) indicates that investors are feeling fearful and uncertain about the market, which may be a sign of an impending price dip.
- A score in the middle range (between 30 and 70) indicates a more neutral market sentiment, where investors are neither overly optimistic nor fearful.
Conclusion
In conclusion, reading a Bitcoin chart can seem intimidating at first, but with a little bit of practice and a basic understanding of the different elements, it becomes much easier.
By learning how to read the various indicators, such as the candlestick chart and the moving average, you can gain valuable insights into the market and make more informed decisions about your trades.
It’s important to remember that no single chart can give you all the information you need and that it’s always wise to consider multiple sources and do your own research before making any investment decisions.
With these tips in mind, you’ll be well on your way to becoming a proficient Bitcoin chart reader and trader.
FAQ
Does Technical analysis work on crypto?
Technical analysis is one of the best ways to estimate the upcoming trend but lower success rate than fundamental analysis. This is all because of the early stage of cryptocurrency adoption. Sanctions, Regulations, bans, etc. affect the market more than any chart patterns. However, we can still say the Success rate of technical analysis is around 60-70% in cryptocurrency.
2. What is the most accurate Bitcoin price Indicator?
There are no indicators with a 100% success rate but many indicators like RSI, MACD, Stochastic oscillator, Bollinger bands, and moving average are important for average price trend estimation.
3. How do you predict the trend of crypto?
Price trends in crypto can be predicted using four steps-
1. finding correct support and resistance levels on the 1-D time frame
2. using Technical indicators like RSI, Stochastic oscillator, and moving average to understand overbought and oversold conditions.
3. Mark chart patterns like triangular, wedges, pennants, etc.
4. Reading on-chain metrics on the blockchain.com